Methods
Structural MRI & relaxometry
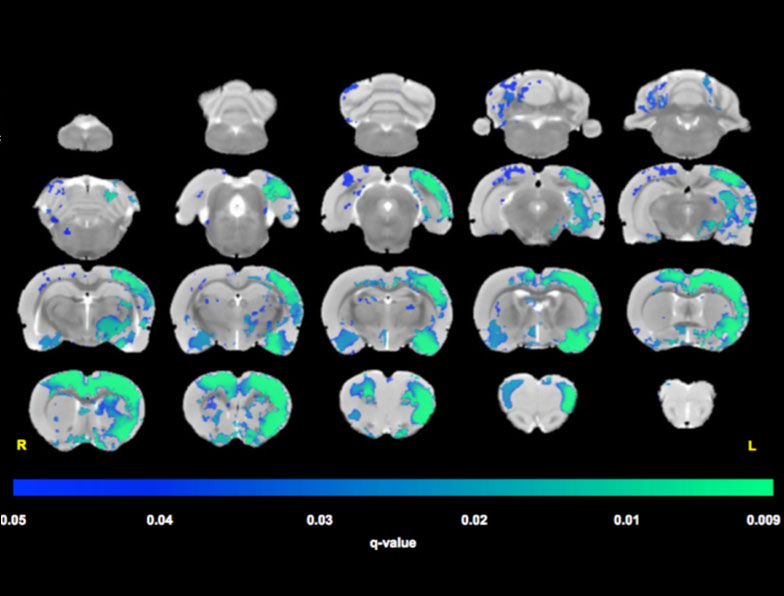
High resolution images such as these can be used to measure structural differences between disease models and controls using automated morphometry methods (e.g. voxel- or tensor-based morphometry, see below). First, the images are co-registered to each other and to a template image, creating group averages, then the groups are statistically compared to reveal the voxels in which there are significant differences. Due to the non-invasive nature of MRI, the brain remains intact and can be further histologically processed to reveal changes in other biomarkers.
Read More
(From: Westphal et al. 2016 Neuroscience 334, 166)
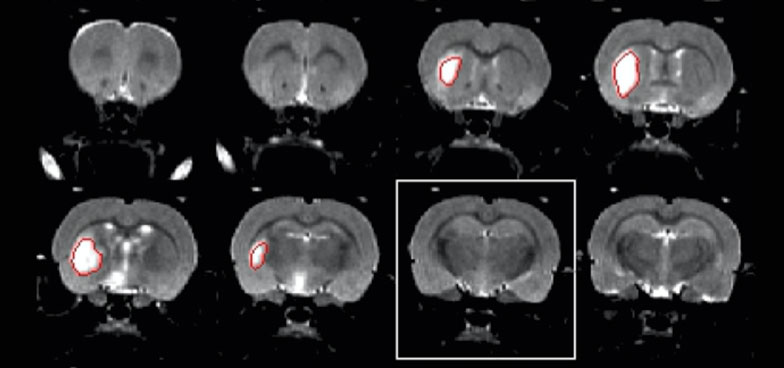
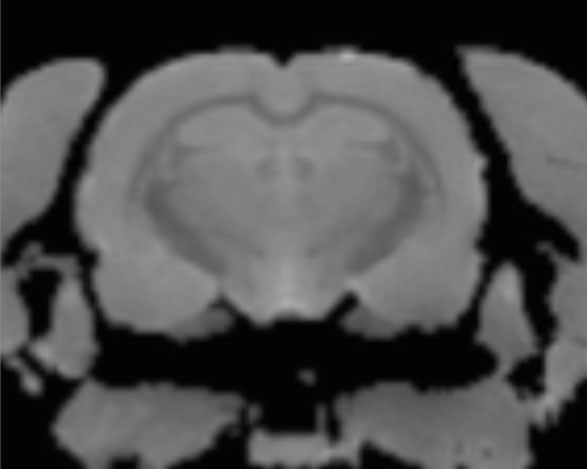
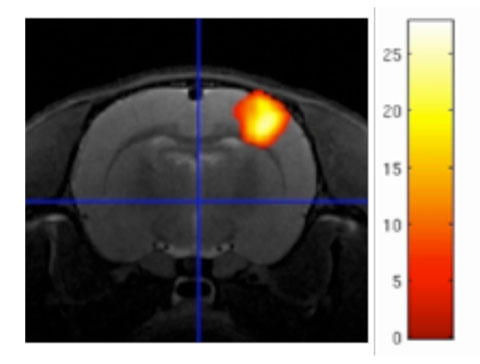
Coronal MR images of experimental stroke model showing a visible hyperintense lesion (contoured red). Image acquired in ca. 10 minutes. (Diana Cash)
Using relaxometry, we can measure T1 and T2 relaxation times in each voxel, deriving additional information about tissue microstructure and changes therein which can be related to developmental, drug- or pathology-induced alternations.
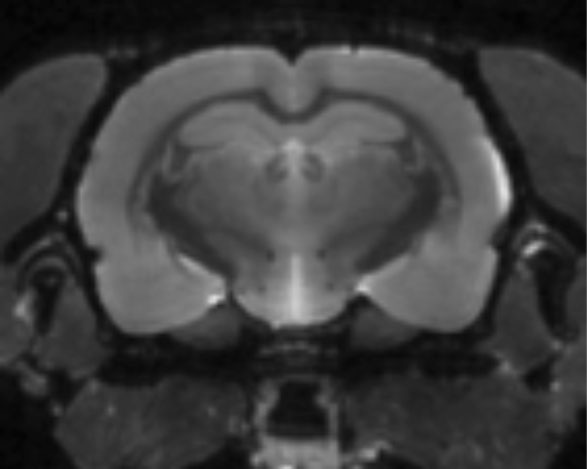
Fast spin echo image
(Toby Wood)
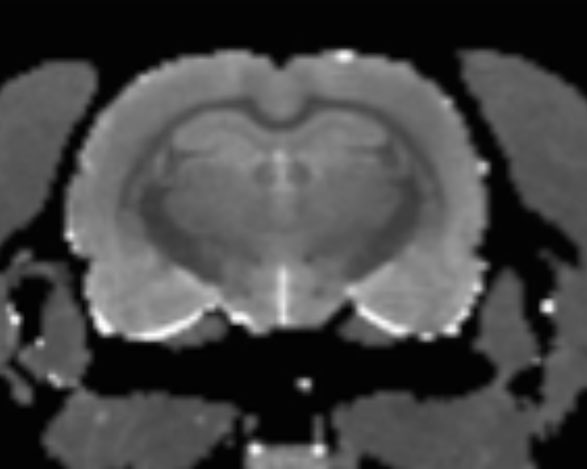
T2 map
T1 map
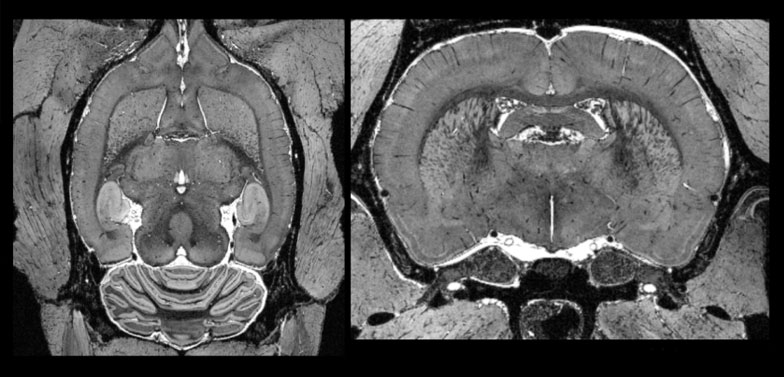
MR image of a rat brain at 48um (F. Dell’Acqua)
Diffusion tensor imaging (DTI)
Diffusion weighted MRI and DTI allows us to ascertain the orientation, trajectory and integrity of nerve fibers. Moreover, quantitative measures such as Fractional Anisotropy, Mean and Radial Diffusivity, derived from DTI, reveal additional information about tissue microstructure in both grey and white matter in the brain.
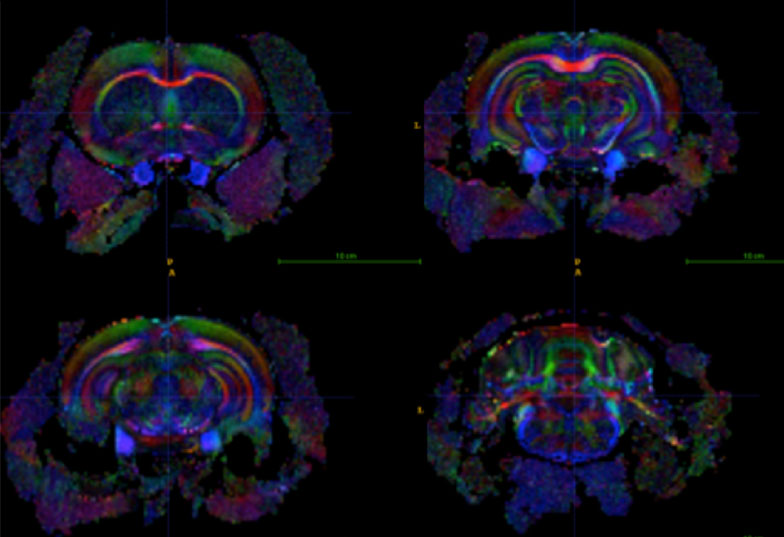
DTI images of a rat brain with fibers labelled by a different colour depending on their orientation (red – left/right, green – up/down, blue – forward/backward)
(Toby Wood and Flavio Dell’Acqua)
Magnetic Resonance Spectroscopy (MRS)
Our high field 9.4T MR scanner is particularly suitable for MRS. MRS, derived from nuclear magnetic resonance (NMR), measures relative concentrations of specific metabolites in areas of interest. For example, an amino acid n-acetylaspartate (NAA) is found in high concentration in neurons and purported to be a marker of neuronal viability. It is therefore reduced by processes that damage neurons, such as neurodegenerative diseases or tumors. Also of great interest are compounds related to brain energy metabolism (e.g. creatine & lactate), white matter and cell membrane pathologies (myo-insitol and choline) and neurotransmission (GABA and glutamate). Using MRS alone, or in combination with other imaging modalities, one can gain better understanding of pharmacological or pathological changes in brain chemistry.
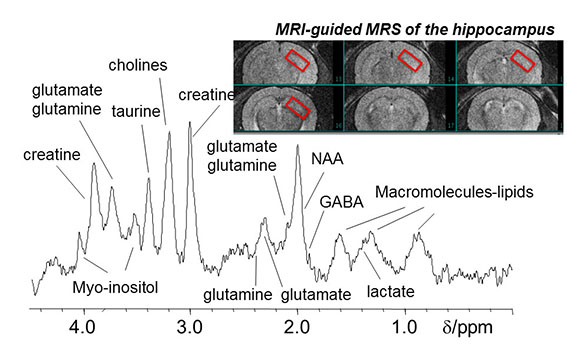
1H MR, water suppressed spectrum from 7.8ul mouse hippocampal voxel
(Po-Wah So)
Functional, pharmacological and resting state MRI
Blood oxygenation level dependant (BOLD) contrast is a result of the coupling between increased neuronal activity and regional blood flow which we can detect by MRI. This phenomenon of neurovascular coupling, together with cerebral blood flow present informative markers of disease and functional impairments in the brain.
Read More
Pharmacological MRI (phMRI) also relies on BOLD contrast or CBF imaging to measure the effect of drugs on the brain. This is a powerful method for testing novel pharmaceuticals or for characterising the responses of the brain further away (‘downstream’) from the primary loci of action e.g. receptor binding.
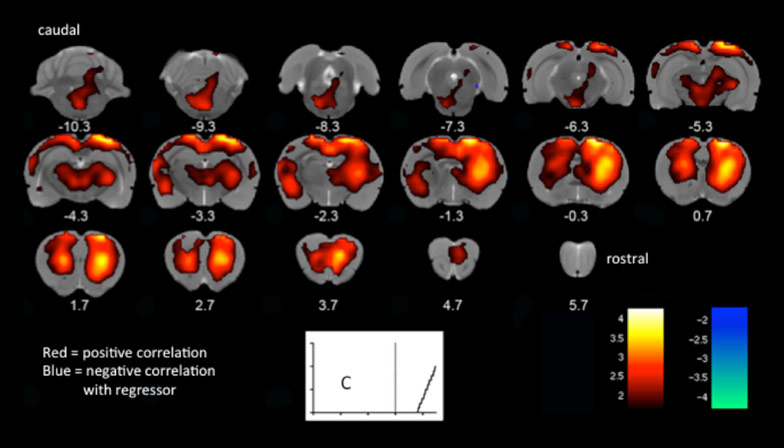
Pharmacological MRI (phMRI)- BOLD response to glutamatergic drug ketamine, administered to rats during scanning. Signal over time is matched to an input function (in C) derived from EEG, resulting in a map of voxels that are significantly correlated with the predicted time-course of ketamine. (Cash, Mesquita, Simmons)
Resting state fMRI is a new emerging method to detect and characterise the brain connectivity and networks at rest i.e. without any stimulation or ‘task’. Alterations in the resting state connectivity have been reported for many pathologies of the human brain. Preclinical imaging, uniquely, can bridge the gap between the clinical picture and the underlying pathology via corroborative and ex vivo explorations.

Functional connectivity maps between the selected ‘seed’ regions of interest in the sham-lesioned and unilateral 6OHDA lesioned rats (Parkinson’s disease model). There is a general loss of bilateral connectivity in the lesioned brains compared to shams particularly for the striatum (CpU) and the sensorimotor cortex (S2 and M1). (Robert Westphal)
Functional MRI (fMRI) – Statistically significant increases (red-yellow) of BOLD contrast in the rat brain during a non-noxious sensory stimulation of the paw. The largest activation is in the cortical forepaw area (yellow centre of ‘blob’).
(Eilidh MacNicol)
Histology
To corroborate the MR imaging, tissue can be processed histologically to measure various biomarkers, such as for example those for inflammation, myelination, neuronal density, neurogenesis or cell death. This ability to combine in vivo and ex vivo investigations in same subjects by following up non-invasive MRI with post-mortem methods is one of the most valuable translational features of preclinical imaging.

Decreased myelin basic protein (MBP) and luxol fast blue (LFB) myelin staining in a mouse model of cuprizone (CPZ)-induced demyelination (compared to controls, CTRL). The same mice were previously imaged by MR revealing widespread changes in regional brain volumes, relaxometry and diffusion parameters. (from: Wood et al. 2016 PeerJ 4, e2632)
Autoradiography
Autoradiography is a method that uses radioactively labelled molecules (‘tracers or ligands’) to label or bind to tissues of interest. Radiolabelled-tracers can either be injected into a living animal (in vivo) or applied to tissue sections (ex vivo) and images are visualized by exposing the tissue sections to x-ray film or phosphoimager screens.
Read More
In vivo autoradiography with 14C-labelled tracers
Cerebral protein synthesis: 14C-leucine, amino acid tracer is administered in vivo and allowed to incorporate into proteins for 60 minutes (image on right). The brain is later sectioned and exposed to x-ray sensitive film which, when quantified, results in quantitative high-resolution maps of cerebral protein synthesis, an important marker for neurodevelopmental or degenerative disorders as well as a potential marker of plasticity and neurogenesis.
Cerebral glucose metabolism: Our team is also skilled in 14C-2-deoxyglucose autoradiography which is related to 18F-deoxyglucose (FDG) PET, and used to quantify cerebral glucose metabolism, known to be affected by disorders such as Alzheimer’s, or brain lesions or CNS-active drugs.

Cerebral glucose utilization maps (umol/100g/min) comparing two anaesthetics: brain metabolism is higher (increased brightness) under halothane (HS) than under chloralose (CS) anaesthesia. (Diana Cash and Toby Roberts)
Other tracers and ex vivo autoradiography
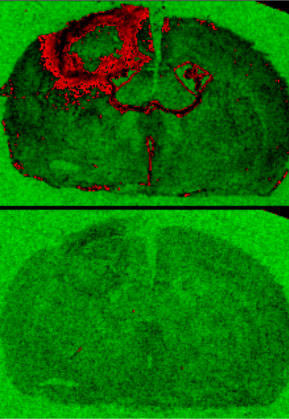
In this example, 3H-PK11195 ligand, applied to brain sections ex vivo, is used to depict the binding to translocator protein (TSPO), a purported marker of inflammation, around the stroke lesion (arrow). Increased binding to TSPO is indicated in red in the top (‘specific binding’) image. The bottom image is a non-specific (background) binding. (Cash, Simmons, Singh)
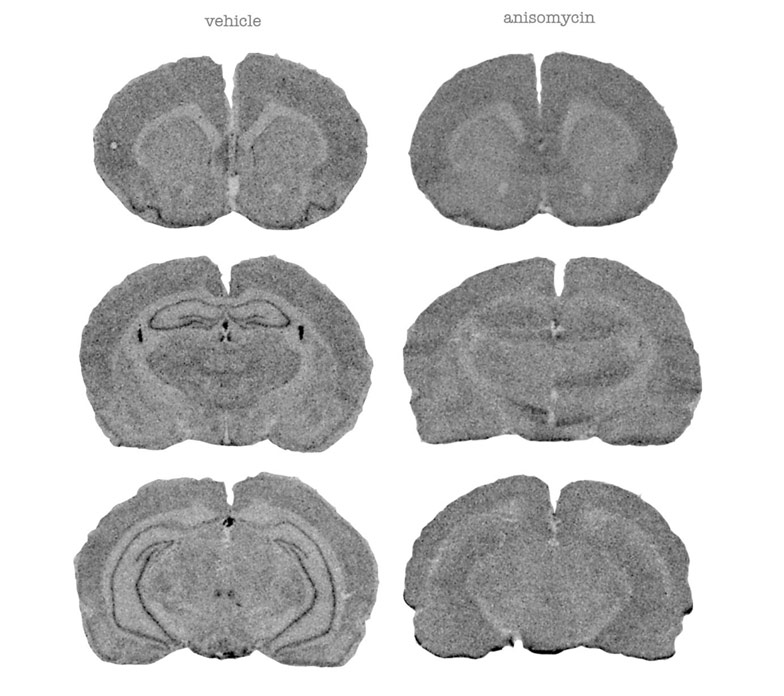
14C leucine autoradiographs in the control (left) and protein synthesis inhibitor, anisomycine-treated rat (right). Note the dissapearance of dark ‘squiggles’, high protein synthesis areas, in the piriform correx and the hippocampus in the images on the right (Cash, Simmons, Vernon)
Electroencephalography (EEG)
EEG can be used to obtain information about brain activity with a temporal resolution superior to that of MRI. Particularly powerful is a combination of EEG (temporal resolution) with other techniques such as fMRI, autoradiography (spatial resolution) or biosensors (chemical specificity) to refine experiments and provide better brain functional fingerprints.
At BRAIN, we can record cortical EEG from the surface of the brain, or from deep brain areas via electrodes implanted in particular stereotaxic coordinates.
Read More
One application of EEG is measuring long-term potentiation (LTP), a mechanism linked to learning and memory. Local field potentials in the prefrontal cortex respond to hippocampal stimulation, and they are potentiated (increased amplitude) after a short burst of tetanic stimulation. The LTP is affected by myriad of conditions including stress, disease or pharmacological interventions.
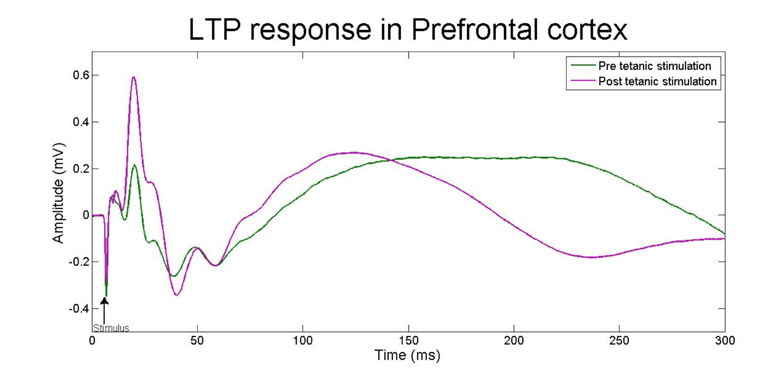
(C. Simmons)
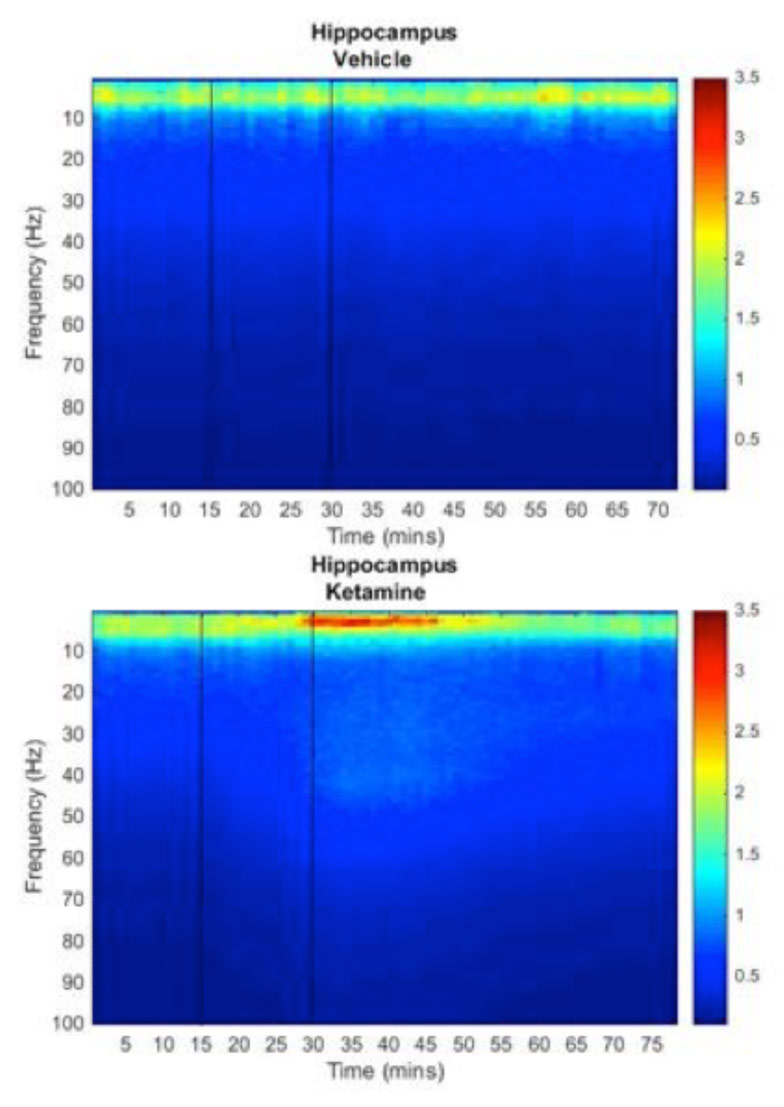
Electroencephalogram Fast Fourier Transform power plots showing the effect of subanaesthetic dose of ketamine on brain activity. Colours show absolute power at each frequency from low (blue) to high (red). (Simmons, Mesquita, Cash)
Microdialysis & biosensors
Microdialysis and biosensors both measure brain chemicals e.g. neurotransmitters from specific locations (via implanted probes).
Microdialysis is a gold standard technique that relies on extracting the chemical of interest in tiny quantity and analysing off line (usually via HPLC). This is very accurate but has relatively poor temporal resolution so it is of limited use.
Read More
Biosensors on the other hand have a temporal resolution more similar to that of EEG. At BRAIN Centre we use commercial sensors from Pinnacle and we also collaborate with Professor John Lowry (Maynooth University, Dublin) on an exciting new range of sensors for oxygen, glucose, glutamate, lactate, GABA and choline, with the potential to develop others of interest.

Biosensor diagram, Pinnacle Technology Inc.

Schematic diagram showing a microdialysis probe implanted in the paraventricular nucleus of the hypothalamus measuring the release of neuropeptide oxytocin (Simmons, Tricklebank)
Behaviour
Behavioural experiments such as Novel object recognition test (NORT), and other tests of cognitive or motor capacity, can be conducted alongside imaging to provide further functional correlates of pharmacological of pathological interventions, thus helping to interpret imaging results in a more meaningful way.
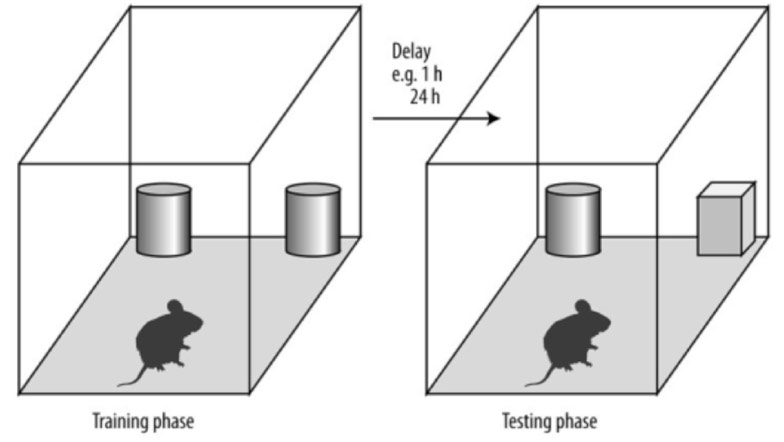
The Novel Object Recognition Test (NORT) for working memory. The protocol of NORT in the training phase allows the experimental animals to explore 2 identical objects. After of a delay (1-24 h) the animal is exposed to 2 objects: 1 familiar from the training phase and 1 novel object. The time that the animal spends to explore the novel object is recorded. Reproduced from https://openi.nlm.nih.gov/detailedresult.php?img=PMC4280055_medscimonit-20-2733-g002&req=4.
Automated analysis software (Cleversys) of rodent locomotor behavour. Rats are filmed exploring the inside of chambers, software then automatically traces and measures their movement parameters (time spent moving, distance travelled etc) over time. This gives us an idea of the animals’ exploratory and locomotor behaviours which are known to be affected by some drugs and diseases such as depression or dementia.
Biochemical & molecular methods
Apart from processing the brain histologically post mortem, biochemical methods such as Western blotting, ELISA and PCR can be employed instead to measure specific protein markers of interest.
Western blot (K. Randall)